
Introduction
Service-learning is generally defined as the integration of community service into the academic content of coursework. In 2003, Monroe Community College (MCC) established an Office of Service Learning and hired a service-learning coordinator to both enhance the Institution’s focus on civic engagement in higher education and to further its own commitment to student learning. While MCC has an historical commitment to community engagement and service, a coordinated, campus-wide approach to the integration of service-learning represents a new initiative. The Office of Service Learning exists to educate faculty about service-learning, to foster partnerships between MCC and the broader community, to assist faculty as they revise curricular offerings to include service, and finally, to more fully and broadly integrate service-learning across the College’s curriculum.
The Center for Governmental Research (CGR) has partnered with MCC to aid in the design and implementation of an assessment plan that will measure the outcomes and impacts of service learning on MCC’s campus and on students who take service learning classes.
Summary
- Students who take service-learning classes respond differently to pre and post test measures of factors including the following: an increased awareness of community needs; an increased awareness of community resources; and an investment in community involvement. In addition,
- Service-learning students are more likely than control group students to indicate that they will continue doing volunteer work independent of a service-learning course: 30% of service-learning students report interest in volunteer work compared with 15% of control group students.
- Service-learning students report both that more of them work for pay in addition to going to school (only 9% of the study students do not work at all, compared with 24% of the control group), and that more of them work nearly full-time than do control group students: 35% of service-learning students work 31 or more hours each week, compared with 28% of control group students.
- After completing a service-learning course, students gain a better awareness of the world outside the College and an appreciation of the College’s attitudes toward its community.
- More of those students who were exposed to service-learning reported a better understanding of the needs and problems of their community than did their non-service learning counterparts.
At the root of service is valuing others, and impacting the values of young people is, quite simply, not something that typically happens in one semester. The legacy of good instruction, combined with laudable values, is one that, at its best, will continue to tug at the conscience and inclination of a student long after he or she has left the classroom. That MCC students would, after the minimal exposure of 20 to 40 hours of varying forms of community service, demonstrate a changing awareness of their own relationship to their school, their community and their world, suggests that their learning has both depth of meaning and breadth of experience.
To answer additional research questions, including changing levels of commitment to academic achievement, CGR recommends that MCC undertake a longer-term evaluation of changing levels of student performance (as measured by retention and GPA) over time.
Methodology
After meeting with the Service Learning Coordinator to better understand and clarify service learning goals, objectives and activities, CGR and MCC jointly determined outcomes and impacts that our evaluation tool would measure. Among these are the following:
- Increased awareness of community needs;
- Increased awareness of community resources;
- Investment in community involvement;
- Increased commitment to hands-on learning;
- Enhanced understanding of career goals;
- Positive impact on citizenship;
- Greater investment in academics.
In the fall of 2004, MCC offered 16 service-learning sections of 10 different courses in disciplines ranging from Sociology to Statistics (Co-op Education/Criminal Justice; Criminal Justice Education; Personal Money Management; Introduction to the Teaching Profession; Foundations of Education; College Composition; Statistics I; Introductory Sociology; Social Problems; Urban Sociology) Students in each of these 16 service-learning sections were given both pre and post tests to determine the nature and extent of the impact of service-learning on those enrolled in the classes. In addition, because these 10 courses are also offered on a ‘non-service-learning’ basis, the pre and post tests were also given to students in these standard classes. Such students formed our control group.
After obtaining all pre and post test data from MCC, CGR analyzed data to understand the nature and extent, if any, of the impact of service-learning on students. We did so by matching responses of individual students (whose confidentiality was protected) on pre and post tests and generating mean scores for both the service-learning and control groups. After obtaining mean scores for both groups, data was further analyzed using t-tests to determine the level of statistical significance between the two groups’ responses to questions.
We report survey results, discuss their implications, and offer recommendations for future study.
Survey Results
We present survey analyses in an order of general to specific. We begin with basic demographic data for a better understanding of who the service-learning students are and how they compare to their control group counterparts.
Table One: Demographics Table One depicts the demographic profiles of the students in the control and study groups. Overall, the study and control groups are generally comparable with relatively few differences between them.
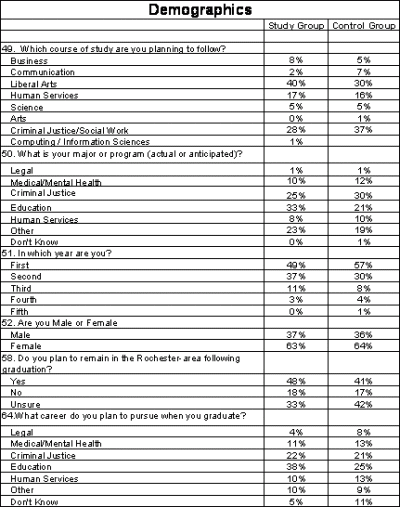
- Both the study and control groups have approximately equal representations of males and females (about two-thirds females in each).
- Students in the study and control groups express comparable degrees of certainty (or uncertainty) about whether or not they plan to remain in the Rochester area after graduation.
- The service-learning students are less likely than their control group counterparts to respond that they ‘don’t know’ about their chosen career, although for both groups the numbers are small (11% of the control group compared with 5% of the study group). Study students are more likely to report that they plan to pursue a career in education, and both groups report comparable levels of interest in careers in medical or mental health professions or in criminal justice.
Table Two: Learning Style and Goals
Table Two depicts student responses to questions concerning issues around learning styles and their own goals for the course in which they are enrolled. We note the following highlights from this descriptive component of the survey:
- Service-learning students report valuing a course for the ‘relevance of its content to real life’ at a much higher rate than do control group students (11% in the service-learning study group compared to 1% in the control group).
- Service-learning students report valuing a course because of their interest in the subject at higher rates than do their control group counterparts (24% in the study group compared to 9% in the control group).
- Both service-learning and control group students are most likely to report taking a class because it is required.
- As is the case with the general population, the greatest numbers of students in both the study and control groups report themselves as visual learners. Interestingly, there seems to be no significant difference between the rates at which service-learning students report themselves as experiential learners compared with those in the control group (33% of study group students see themselves as experiential learners compared with 28% of control group students who identify themselves as such.)
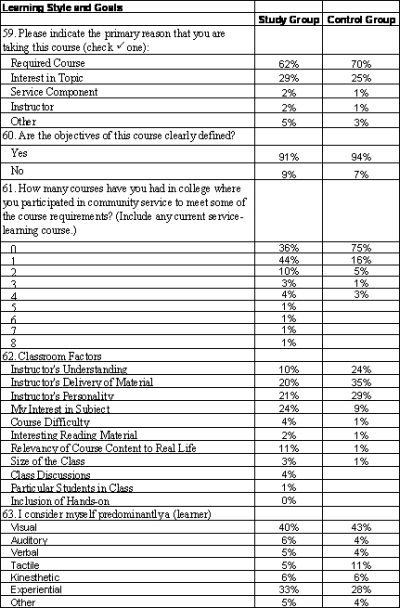
Students in the study group, despite being currently enrolled in a service-learning class, seem to have misunderstood Question 61 since 36% indicated that even including the current class, they had never taken a service-learning course.
Table Three: Service and Work Obligations
Table Three, below, illustrates students’ responses to questions about their Service and Work Obligations and describes issues relative to their lives out of school.
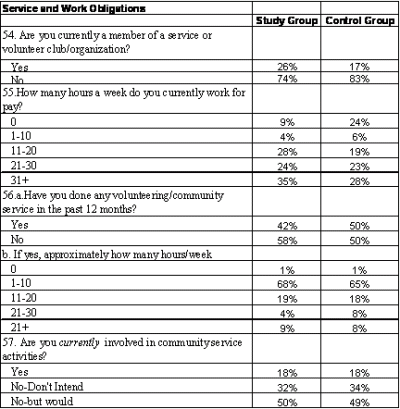
- Service-learning students report belonging to a service or volunteer organization club at a slightly higher rate than do control group students (26% for study students compared with 17% for the control group.)
- Service-learning students report both that more of them work for pay in addition to going to school (only 9% of the study students do not work at all, compared with 24% of the control group) and that more of them work nearly full-time than do control group students: 35% of service-learning students work 31 or more hours each week compared with 28% of control group students.
- Half of all control group students report having volunteered in the last 12 months; 42% of all service-learning students say they have done so.
- Students in the control and study groups report identical current levels of volunteer activity; 18% of students in both groups are currently volunteering.
- Students in both groups also report nearly identical rates of ‘intending to volunteer’; about half of both groups plan to volunteer in the future.
Table Four: Student Attitudes Toward Community
Table Four indicates student responses to questions regarding their attitudes toward their community, their educational institution and the role between the two. We report the data for both service-learning students and for their non-service learning, control group counterparts, and we report responses on both the pre and post tests.
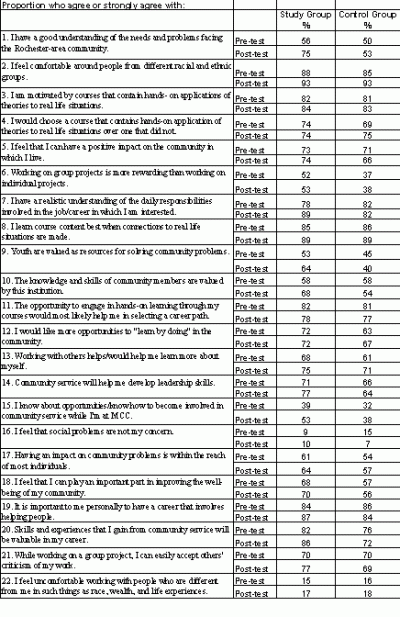
Differences between the two groups on pre and post testing are revealed most dramatically in Questions 1 and 15. As Question 1 demonstrates, students in service learning classes began their semester with approximately a comparable level of ‘understanding of the needs and problems facing the Rochester-area community’: 56% of service-learning students agreed or strongly agreed that their understanding in this regard was good, compared with 50% of the control group. At the end of the semester, service-learning students agreed or strongly agreed with this statement at a higher rate, about 75%, compared with no significant change for the control group’s reporting of their understanding of such needs’ 53%. In this instance, more of those students who were exposed to service-learning reported a better understanding of the needs and problems of their community than did their non-service learning counterparts.
Question 15 indicates that on pre-test measures, service-learning students agreed or strongly agreed that they were both aware of and knew how to participate in community service projects at MCC at a slightly higher rate than control group students (39% compared with 32%). Post-test reporting, however, shows a large increase in the percentage of service-learning students who agree or strongly agree with the statement and only a modest increase for the control group (53% compared with 38%). Service learning students are more likely than non-service-learning students to increase their awareness of community service opportunities.
While questions about being connected to the community reveal the largest differences between service-learning and control group students, other questions also suggest noteworthy distinctions between the two groups. For example, in Question 7, service-learning students initially report understanding ‘daily responsibilities involved in the job/career in which [they] are interested’ at slightly lower rates, 78% compared to 82%, than do their control group peers on pre tests. But after a semester of service-learning, student reporting on post-tests indicates that service-learning students agree or strongly agree that they understand such factors at higher rates than do their control group peers, with agreement rates of 89% and 82% respectively.
Similarly, pre and post test responses for service-learning students on Question 9 not only show an increase in students who agree or strongly agree that ‘youth are valued as resources for solving community problems’ (from 53% to 64%) but also a decrease in the percentage of control group students who agree or strongly agree with the same statement (from 45% to 40%). These numbers suggest both that the service-learning experience benefits students who participate in it and, further, that those students who do not have the opportunity to experience service-learning may feel less important as a community resource by comparison.
While service-learning students agreed or strongly agreed to questions on the nature of their community’s attitudes toward youth as a resource at rates higher than the control group on pre tests (Question 9), service-learning students were no different from their control group peers on their pre-test rates of agreement to statements about their institution’s valuing ‘the knowledge and skills of community members’ (Question 10). Both agreed or strongly agreed at a rate of 58%. Yet on post-test measures, control group students agreed or strongly agreed at slightly lower rates than they had previously (54%), while service-learning students agreed at a noticeably higher rate (68%). This change suggests that after completing a service-learning course, students gain a better awareness of the world outside the College and an appreciation of the College’s attitudes toward its community.
Table Five: Valuing Service
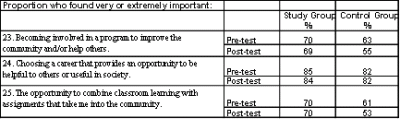
Data in Table Five indicates that pre and post test measures on responses to questions regarding the value of service differ slightly for study and control groups. Neither group responded differently on pre and post testing to Question 24, which asks about the value of choosing a career that helps others or is valuable to society. But on Questions 23 and 25, while the study group’s responses remained relatively unchanged, the responses for the control group differed. Specifically, as time passed, control group students were less likely to find import or value in either the opportunity to link classroom learning to work in the community or to see merit in becoming involved in programs that help others. Service learning students continued to value service to others at comparable proportions over time.
Table Six: Students Rate Their Skills
Table Six illustrates service-learning and control group responses to pre and post test questions rating their own skills and activities relative to others. Generally, there were not substantial differences between the way study and control students viewed themselves and their abilities relative to those of others.
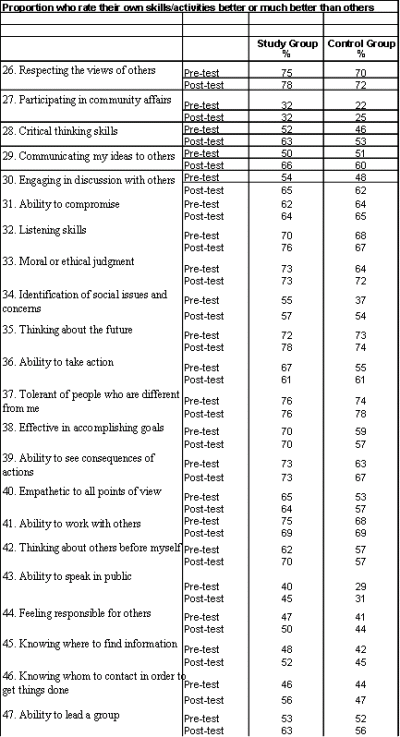
- Question 41 suggests that after exposure to service-learning opportunities, students may gain a better awareness of the complexities inherent in meaningful teamwork. Study students rated their skills lower in this regard on the post test than they did on the pretest. By comparison, the control group showed no real difference in pre and post test reporting.
- In a related vein, Question 42 indicates that along with an awareness of challenges in group work, study students also reported having gained a greater appreciation for the values and needs of others relative to their own. A higher percentage (70%) reported feeling that they were better or much better than others on the post test at thinking of others before themselves.
- Questions 46 and 47 suggest that service-learning students reported feeling better about their abilities both to locate resources and to lead groups than they had on pre test measures.
Table Seven: Attitudes Toward School and Community
This next group of Tables, Numbers Seven through Nine, describe changes in mean or average scores over time and depict changes in student responses in a slightly different way from related Tables Four through Six. Tables Four through Six describe the responses of students who answered at the upper end of possible responses, either by ‘agreeing or strongly agreeing’ or by rating their skills ‘better or much better’. Tables Seven through Nine report change in total mean scores for all respondents, including those answering at the lower range of possible responses. We report both for several reasons. First, upper-end responses are important inasmuch as they describe the greatest possible response or impact. They describe changes of substance. With any intervention, we would anticipate seeing changes in this area. Second, mean or average score changes are important because they describe the changing picture over time throughout the full range of responses and, further, allow for researchers to understand which changes, while not necessarily substantial, are statistically significant.
A number of questions on both pre and post testing indicate differences between the way the service-learning and control groups think of themselves after time spent taking a service-learning course.
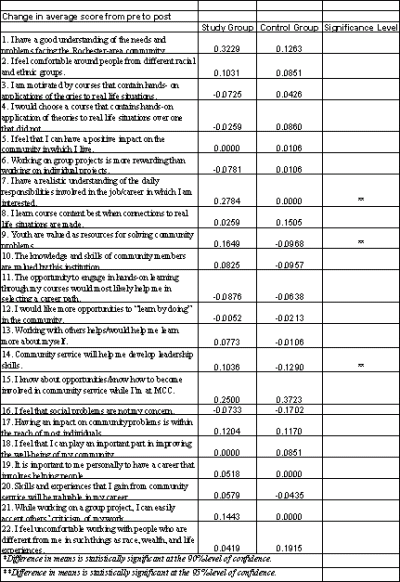
Analyses of pre and post tests for students who took service-learning classes reveal statistically significant differences in attitudes toward learning on several different questions.
- Question Seven reveals a statistically significant difference between study and control groups’ understanding of responsibilities involved in the job or career they are pursuing, at a confidence level of 95%. Students were more likely to report a gain in such understanding after taking a service-learning course.
- Question Nine indicates a statistically significant difference in the change over time between control and study groups in feelings about how the community values youth as a resource, again, at a confidence level of 95%.
- Finally, again at the 95% confidence level, differences exist between study and control groups’ changes in feelings about the value of community service as it can help to develop leadership skills.
Table Eight: Valuing Service Change Over Time
Table Eight indicates student responses on both pre and post test measures, on questions regarding learning, community service, and the integration of the two. T test analyses reveal that for none of these questions were the differences statistically significant.
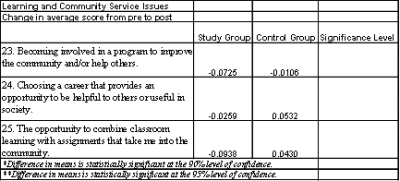
Table Nine: Students Rate their Skills
When students in service learning and non-service learning classes evaluate their skills on pre and post test measures, we see statistically significant differences on several questions.
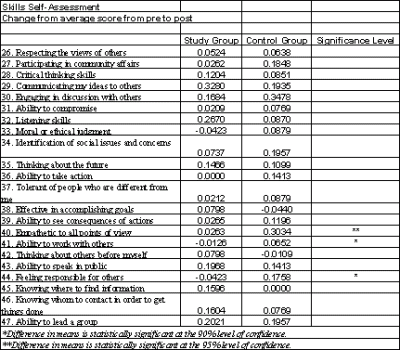
- Service-learning study students report changes in their levels of empathy for all points of view at a lower rate than do their control group counterparts, at a statistically significant rate with a 95% level of confidence. In other words, the mean scores for both groups are not only different enough to be descriptive, but also to suggest changes in those mean scores over time (the duration of the service-learning or non-service learning class) that are significant.
- Service learning students report changes in feelings both about their ability to work with others and in their feelings of responsibility for others at rates that differ from their control group counterparts with a statistically significant rate of confidence of 90%. That is to say, the difference in the mean scores for these two groups over the course of the duration of the classes in question is significant.
- Question 41 may suggest that part of the value of the service-learning experience for students lies in helping them to gain real world understanding of the challenges inherent in working with others. Study students were less likely to rate their skills in this area high after the experience of community service.
Table Ten: Course Evaluation
Finally, we report students’ evaluation of their courses.
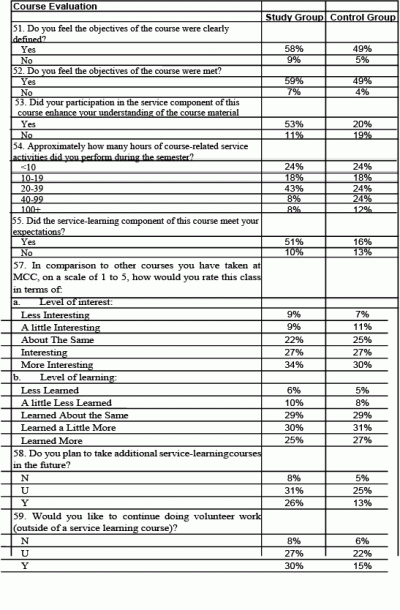
- Service-learning students report feeling both that course objectives were better defined and that those course objectives were better met than did control group students.
- Service-learning students are more likely than control group students to indicate that they would like to continue doing volunteer work independent of a service-learning course than are control group students: 30% of service-learning students report interest in continuing volunteer work, compared with 15% of control group students.
- More than half, 53% of students who take service-learning courses, agree or strongly agree that the service component helped their understanding of the course material.
- About one-fourth, 26%, of service-learning students agree or strongly agree that they would take additional service-learning classes in the future, compared with 13% of the control group students.
- According to Question 54, a higher percentage of control group students performed more than 40 hours of service during the semester compared to study students: 36% of the control group reported serving 40 or more hours, compared with 16% of the study group. Reasons for this are unclear.
Conclusion
Differences exist between pre and post test measures of service-learning students and their control group counterparts. The challenge for a researcher becomes determining whether the differences may be appropriately attributed to the service-learning class itself or to the myriad other factors that impact young adults at this stage in their lives. The question is one of causality. Are the service-learning classes primarily responsible for the difference in responses that we observed on the surveys?
At the root of service is valuing others, and impacting the values of young people is, quite simply, not something that typically happens in one semester. The legacy of good instruction, combined with noble values, is one that, at its best, will continue to tug at the conscience and inclination of a student long after he or she has left the classroom.
That MCC students would, after the minimal exposure of 20 to 40 hours of varying forms of community service, demonstrate a changing awareness of their own relationship to their school, their community and their world, suggests that their learning has both depth of meaning and breadth of experience. It gives them a foundation on which to build a life and career of substance.
Recommendations
- Continue to build on existing database;
- Incorporate student GPAs and retention data into database, and update each semester;
- For research purposes, maintain parallel sections of service-learning and non-service-learning sections of the same class;
- Track students in both classes according to existing survey and GPAs;
- Consider standardizing service component across disciplines to reduce variations in implementation of service-learning;
- Should funds allow, establish means of tracking students once they finish at MCC;
- Administer follow-up surveys to service-learning alumni to allow for longitudinal reflection on the service-learning experience.
Acknowledgements
CGR gratefully acknowledges the fine work of those in Monroe Community College’s Office of Service-Learning, including Susan Bender and Pat Joram. Don Pryor served as Project Director. Rebecca Sumner was principal researcher and report author, with Sarah Boyce overseeing data analysis and Katherine McCloskey providing able research support.
About the Author:
Susan Bender is the Service-Learning Coordinator for Monroe Community College where she also serves as an adjunct in the Visual and Performing Arts Department. Prior to service-learning, Susan was the Assessment Coordinator of the Work and Learn program and has been employed at Monroe Community College since June, 1999.
Susan coordinates the service-learning curriculum, teaches service-learning courses, and provides training to all new service-learning faculty at MCC. She has written numerous articles, designed service-learning courses, and has given presentations and trainings about service-learning both regionally and nationally. Susan is a national trainer for the Supporting Actions For Engagement grant (SAFE) which provides extensive training on how to integrate service-learning into curriculum related to homeland security and domestic preparedness.
Susan is a Nationally Certified Counselor of the National Board for Certified Counselors (NBCC) and a member of the Counseling Academic and Professional Honor Society International, Chi Sigma Iota. Susan is also a member of the American Counseling Association and The American Association for Women of Community Colleges.
She obtained a Master of Science in Education from the State University of New York at Brockport and a Bachelor of Arts in Psychology from the State University of New York at Cortland.
Phone: 585-262-1710; Fax: 585-262-1615; E-Mail:Sbender@monroecc.edu